
Peter Drucker said “you can’t manage what you can’t measure”. Here’s how to gauge the success of disability inclusion / accessibility initiatives
utcome is frequently quantitatively measured using benchmarks. Let’s say you need to get somewhere. You need four pieces of information to know whether or not you have met that goal:
- Where are you? (the starting point)
- Transportation process (drove, flew, took a train)
- Where did you end up (the destination)
and finally
- Did you end up where you wanted to end up?
Outcome is frequently quantitatively measured using benchmarks. Let’s say you need to get somewhere. You need four pieces of information to know whether or not you have met that goal:
- Where are you? (the starting point)
- Transportation process (drove, flew, took a train)
- Where did you end up (the destination)
and finally
- Did you end up where you wanted to end up?
In most outcome measurements, there are several ways that the outcome can be reached. Which one is the best depends on what is the most important at the time the process is being executed.
- If you are trying to get to New York, you are in California and the most important factor is speed, flying might be the best choice.
- If you are in Boston, the train might be a better choice.
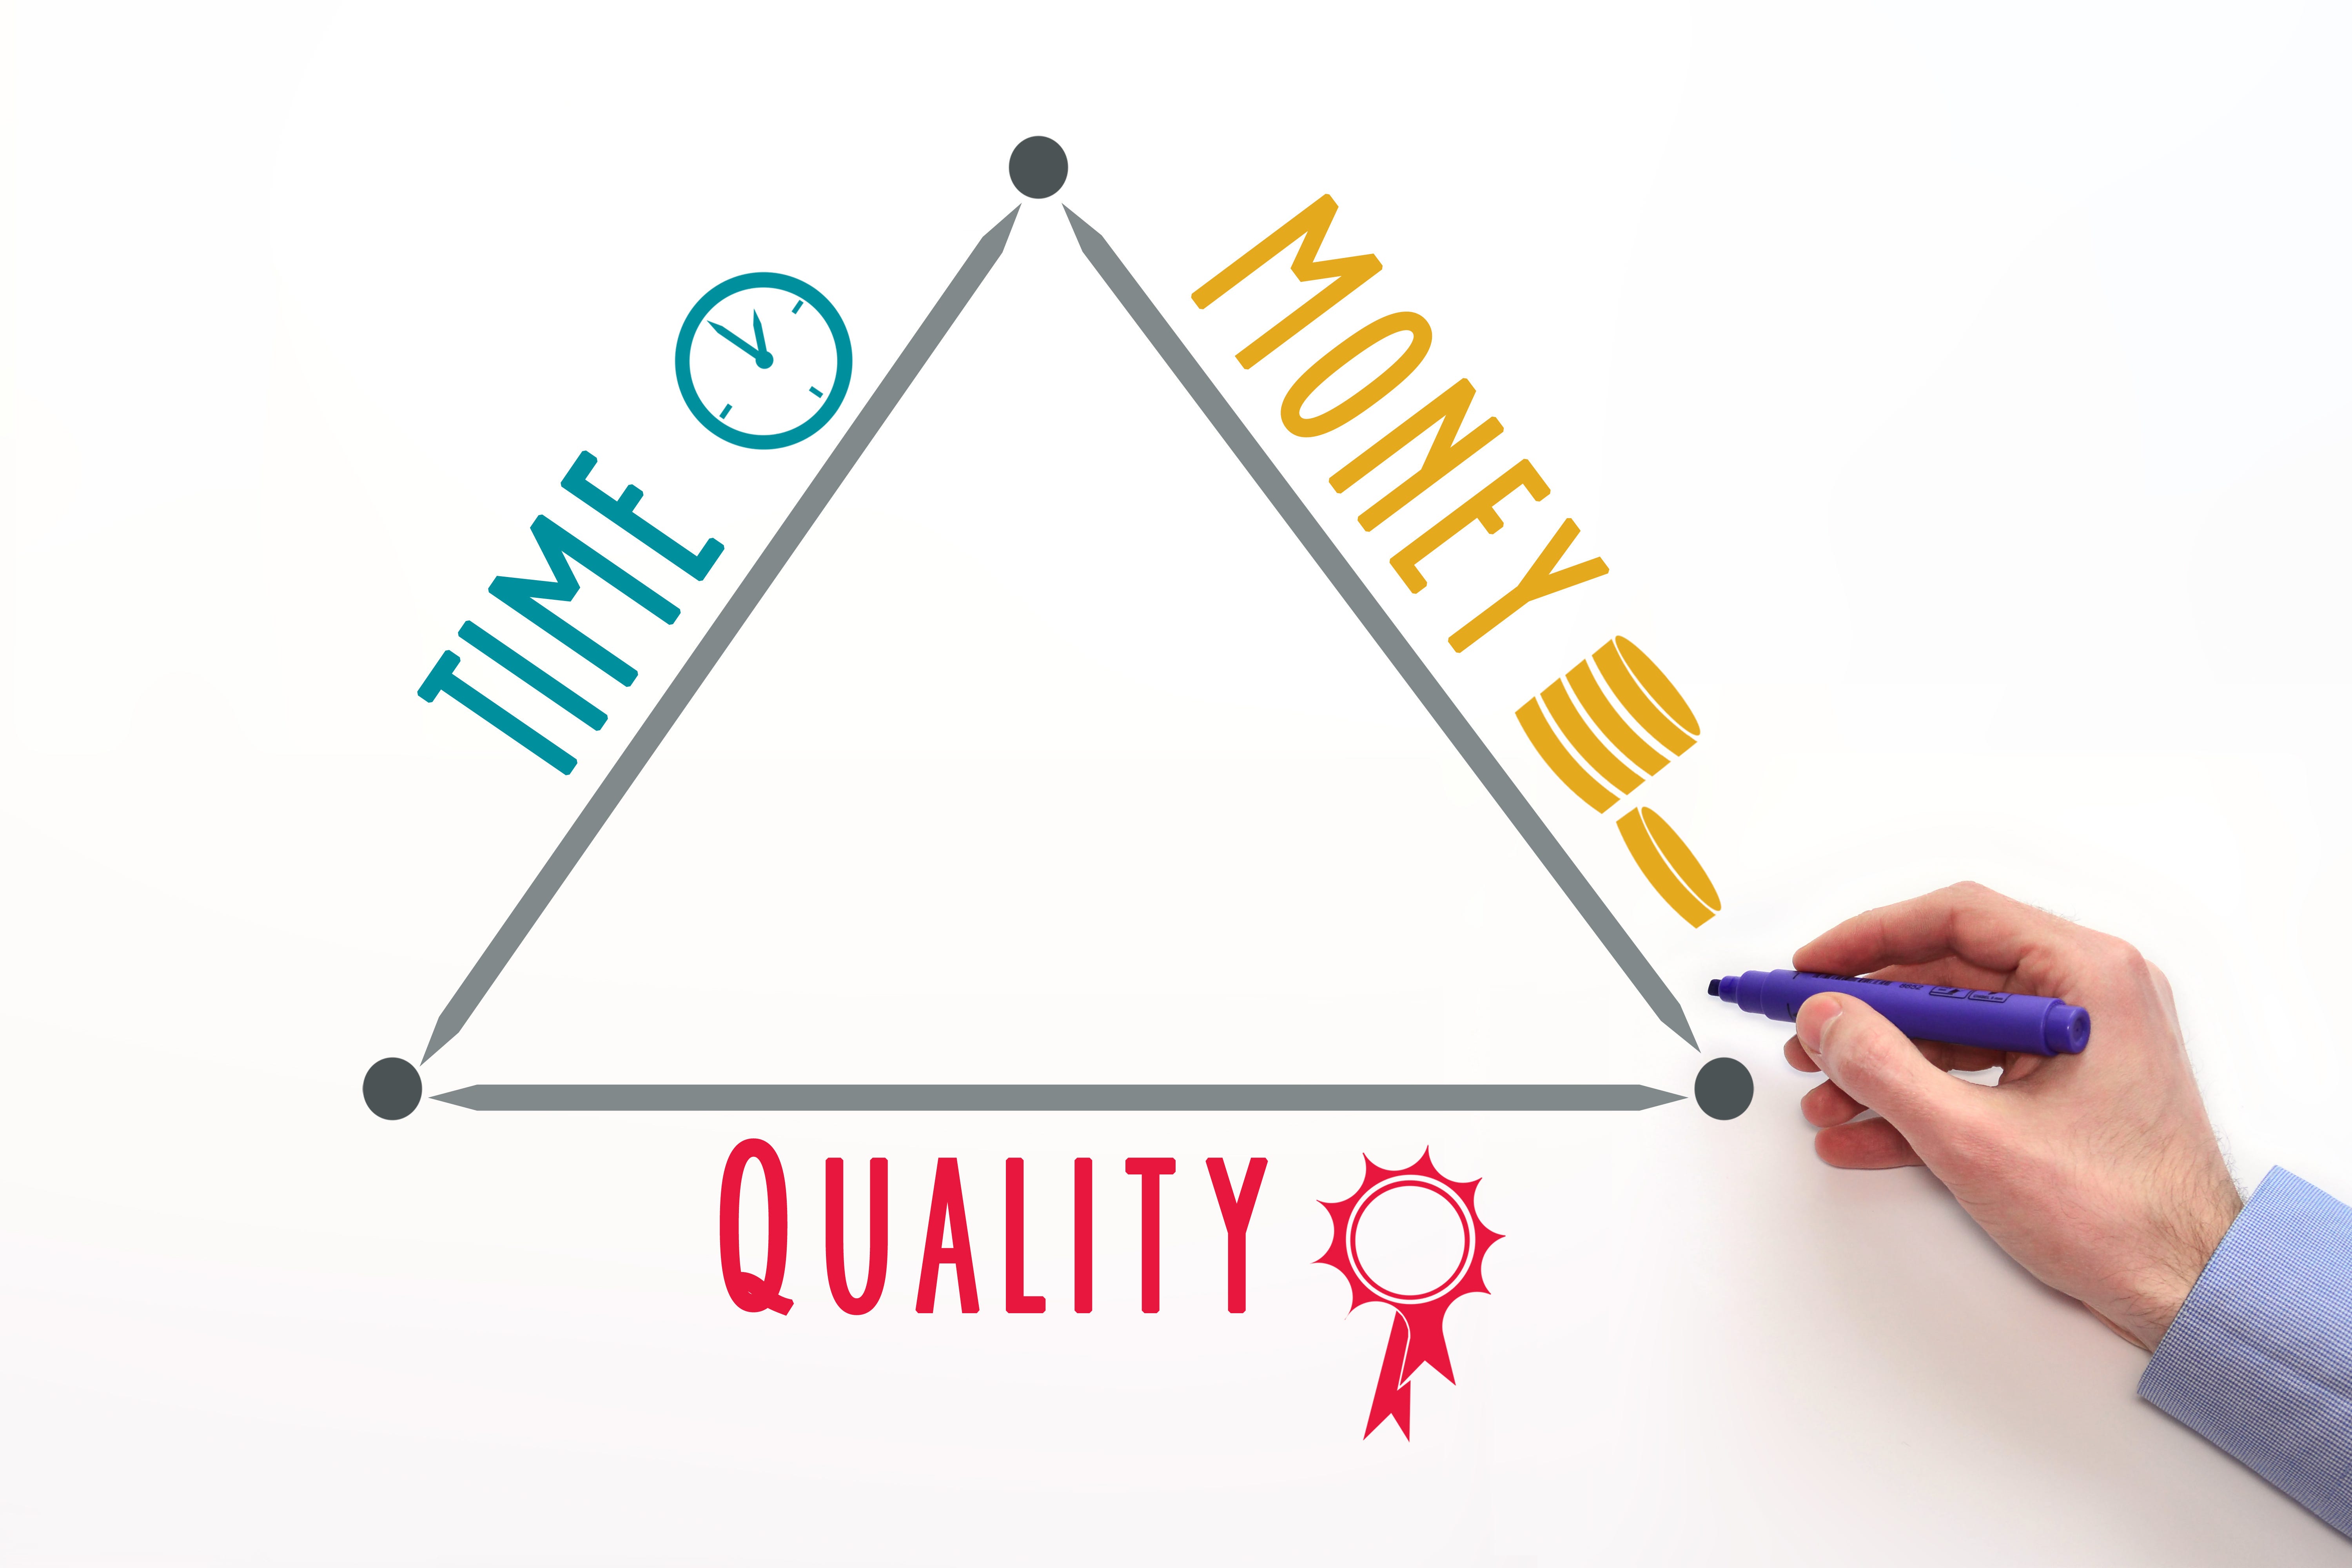
A benchmark is a standard or point of reference against which progress may be assessed. Quantitative benchmarking is a common statistical approach that compares performance results in terms of key performance indicators (KPIs) for just about any segment of any manufacturing or tech organization. Quantitative benchmarking can be a really important aspect of figuring out whether an organization is undertaking the right activities with the correct application of importance factors. So why not apply it to accessibility and disability inclusion?
You have to know where you are starting from
Every type of measurement of progress (either forward or negative) requires first understanding where you are at, before modeling the inclusive / accessible behaviors.
For disability inclusion, the most important “starting point” to know is organizational self-identification rates. The choice to self-identify as a person with a disability is entirely up to the individual. However, employers who consider disability inclusion behavior important to their organization want to foster an environment where employees feel comfortable self-identifying as a person with a disability.
For accessibility, the “starting point” can be more complicated. Some accessibility starting points are objective:
- how many bugs do you have? (usually stratified by WCAG 2.0 / 2.1 and then by Level A/ Level AA)
- how many certified testers do you have?
- are your certified testers employees or contractors?
Some accessibility starting points are a little more nebulous and process oriented, such as whether accessibility embedded in your procurement or release processes, for example.
- Did you end up where you wanted to end up?
What are your importance factors?
- If your destination is to release products with no more than five WCAG 2.1 A defects, then “quality” would be your most important factor.
- If your destination is to increase the self-identification rate from 2 % to 3 %, if the timeframe is 3 months, then “speed” would be the most important factor. If the timeframe is a year, then some other factor (like cost) might eclipse speed.
Quantitative Benchmarks
This is not intended to be an exhaustive list of things that can be measured related to disability inclusion, but examples that can be used in deciding what resonates best with your organization
Disability Inclusion
- Track disability self identification rates. They should increase over time as an organization becomes well known as a good place for people with disabilities to land, and existing employees choose to update their self-identification status.
- Explicitly include disability as part of the talent acquisition strategy. This can be accomplished by participating in university recruiting events specifically targeting students with autism, for example. Other methods of accomplishing targeted recruiting might be participation in relevant conferences, such as regional ADA conferences or DisabilityIN.
- Measure elements of disability maturity. Are you procuring accessible software? Training on disability-related issues? Offering reasonable accommodations to everyone starting with the interview process?
- Complete the Disability Equality Index and then create a disability inclusion roadmap from the gaps identified by the results.
Accessibility
- Learning assistive technology. Each developer and QA expert should be fluent in at least one piece of assistive technology.
- Regression rate. Once a bug is fixed, it should never reappear, as that is indicative of a failure in the code review and testing process. A good regression rate is below 10 %, a great rate is below 5 %.
- Level A / Level AA ratio. Level A defects are more severe, since they regularly block a group of people using assistive technology from being able to use that section of the product. Testing in a mature accessibility organization should have a 3:1 ratio (or better) between AA and A defects (i.e. three times as many AA defects found as A defects)
Where is your destination?
Once you know an organization’s starting point, what is important, and some of the processes to be measured, the next step is determining the destination. Some examples would include “We want:”
- to increase our self-identification rate from 2 % to 3 %
- to release products with no more than five WCAG 2.1 A defects
- three new engineers to take the CPWA test.
What do you know about your users?
There are things you can measure quantitatively about your users with disabilities:
- Who is using closed captioning? Are they using it situationally or all the time?
- Who is using a keyboard over a mouse? Again, situational or permanent?
- Are the number of people using accessibility features in your product going up over time?
If your product does personalization with accessibility options, it is relatively simple to track who has personalized their experience optimizing for particular accessibility features.
That being said, people with disabilities fear being tracked. That approach has frequently ended badly for us in the past. The important thing is to use this information ONLY to prioritize remediation and quantify who is using what and when to make strategic decisions that will BENEFIT your users with disability. If you use accessibility metrics to send your users with disabilities into an accessibility ghetto, you will be risking a $500,000 fine like that which was handed to SAS who did exactly that.
Once an organization starts quantitatively measuring accessibility and disability inclusion goals, then it can reward positive behavior and penalize bad behavior. This can be accomplished by tying at least a portion of bonuses to achieving disability and accessibility related goals. If employees receive bonuses for staffing, on-time releases, or features, but not for modeling disability inclusive or accessibility behaviors, guess what the employees will focus on? This is a clear instance of the WIIFM principle — What’s In It For Me?
This article was inspired by https://www.linkedin.com/pulse/get-off-bench-start-benchmarking-jonah-mclachlan/
0 comments on “Measuring Accessibility Outcomes”